Reporting & Analytics Explained

Analytics is “the process of exploring data and reports in order to extract meaningful insights, which can be used to better understand and improve business performance

Reporting is “the process of organising data into informational summaries in order to monitor how different areas of a business are performing.”

Reporting provides you with information and raises questions, whilst analytics gives you insights and attempts to answer those questions.

So why are analytics so special?

They explain the “why?” and the “so what?” because the information is dynamic on more than just a scale of time or interval. You should be able to contort the data to whatever you need. If what you see is a set of standard metrics, then it isn’t truly an analytic assessment (or an analytics product).

From this dynamic investigation into the data, you can derive real-life recommendations about your business.

How should you improve your core metrics?

In this way, analytics is also special because it’s extremely actionable. In fact, it must be acted upon. The value of analytics is only truly delivered upon your own follow up, only if you come up with those recommended next steps and execute them. More on that below.

Measuring core metrics and presenting them — whether in an email, a slide deck, or online dashboard — falls under this category.

The following are examples of reporting and analytics in deferent business areas:

Customer Success

Reporting metrics

  • Revenue
  • Cash flow
  • Cost to deliver services

Analytics

  • Does cancellation rate compare with services offered and new sales?
  • Profitability analysis across services, accounts, billing options, jurisdictions.

Marketing

Reporting metrics

  • Revenue
  • Cash flow
  • Cost to deliver services

Analytics

  • Does cancellation rate compare with services offered and new sales?
  • Profitability analysis across services, accounts, billing options, jurisdictions.

Sales

Reporting metrics

  • New business monthly recurring revenue vs annual billing
  • Customer Acquisition Cost

Analytics

  • Which individual and jurisdiction have highest retention?
  • Which products or services constituted our highest sales last month?

Finance

Reporting metrics

  • Number of qualified leads
  • Customer Acquisition Cost (CAC)
  • Lifetime value vs Customer Acquisition Cost

Analytics

  • What’s our Monthly Reporting Revenue broken down by lead source?
  • How much of our new business can be attributed to marketing campaigns
  • Which marketing campaigns have the lowest ROI?
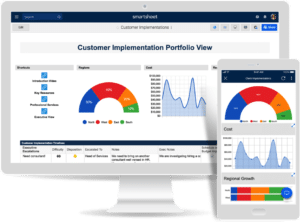
Smartsheet

KoP are Channel partners for Smart Sheet which is a collaboration tool best used to plan, capture, manage, automate, and report on work, enabling you to move from idea to impact…. fast.