The following are five Smartsheet apps designed to help you visualise your work:
Deliver Powerful Analysis and Reports in Tableau
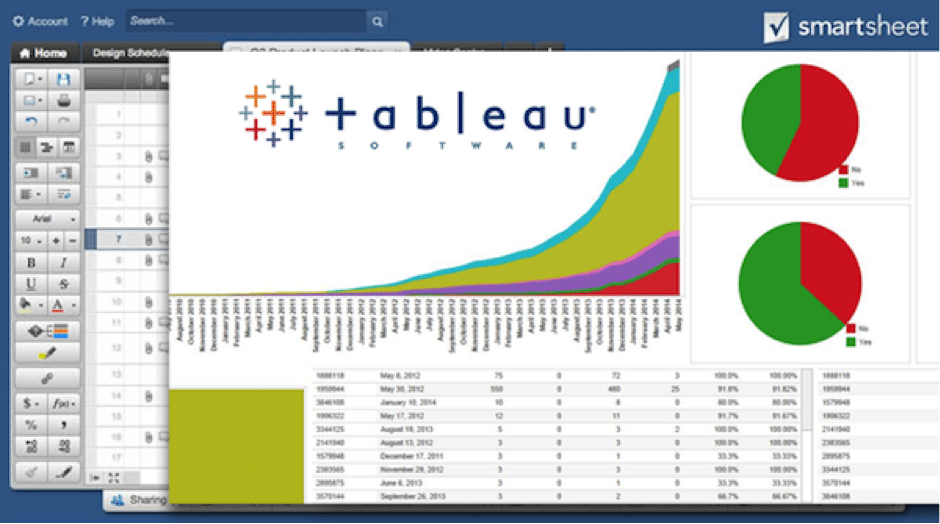
You and your team can discover powerful analysis and insight by integrating Smartsheet data into Tableau. The Smartsheet Live Data Connector establishes a real-time connection between Smartsheet and Tableau, allowing you to create complex, live visualizations that you can share across the organization. Learn more about connecting Smartsheet and Tableau.
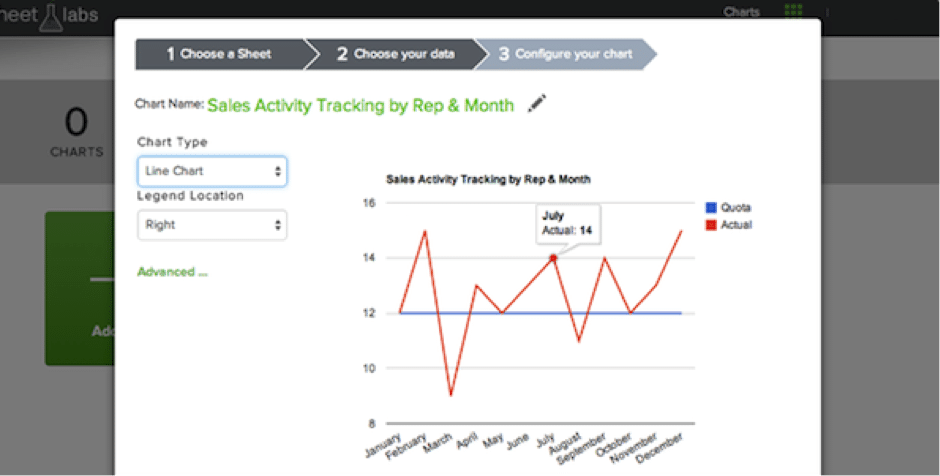
Visualize Smartsheet Data in Charts or Graphs
Surface trends and visualize key information from project plans, team status reports, and more. You are able to customize your graph, choosing from line, column, bar, pie, or other popular chart types. Then, include the graph in your presentations, embed it in a web page, or share a link with your team to keep everyone updated. See how to turn your data into charts.
Make Beautiful Project Plans with Office Timeline
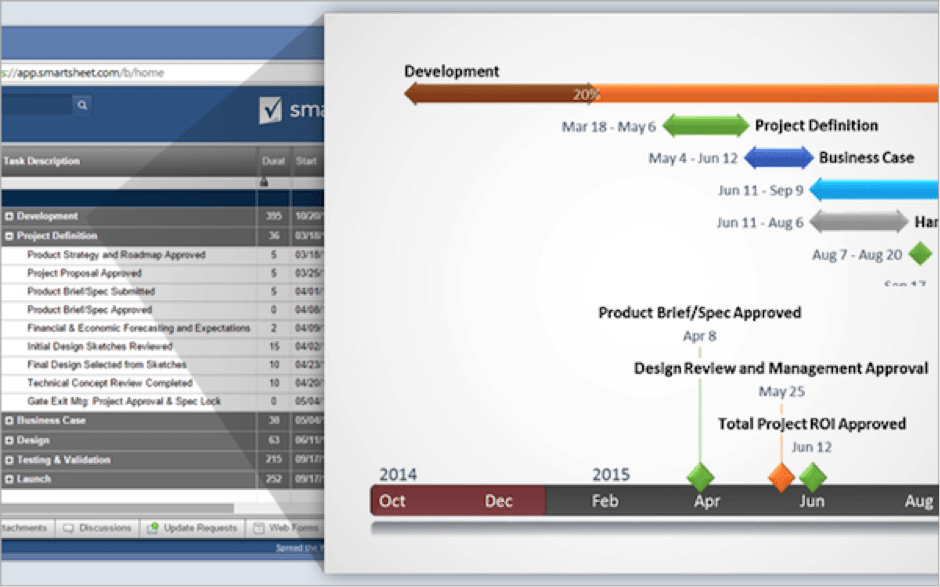
Impress your boss, colleagues, and customers with a beautiful visual representation of your project plan in your next presentation. With the Smartsheet and Office Timeline integration, you can visually display your work and highlight the most important parts of your plan. Use filters to weed out unnecessary data, customize your presentation with colours and shapes, and easily share with others as an image, pdf, or PowerPoint slide.
Build a Customized Dashboard in Excel
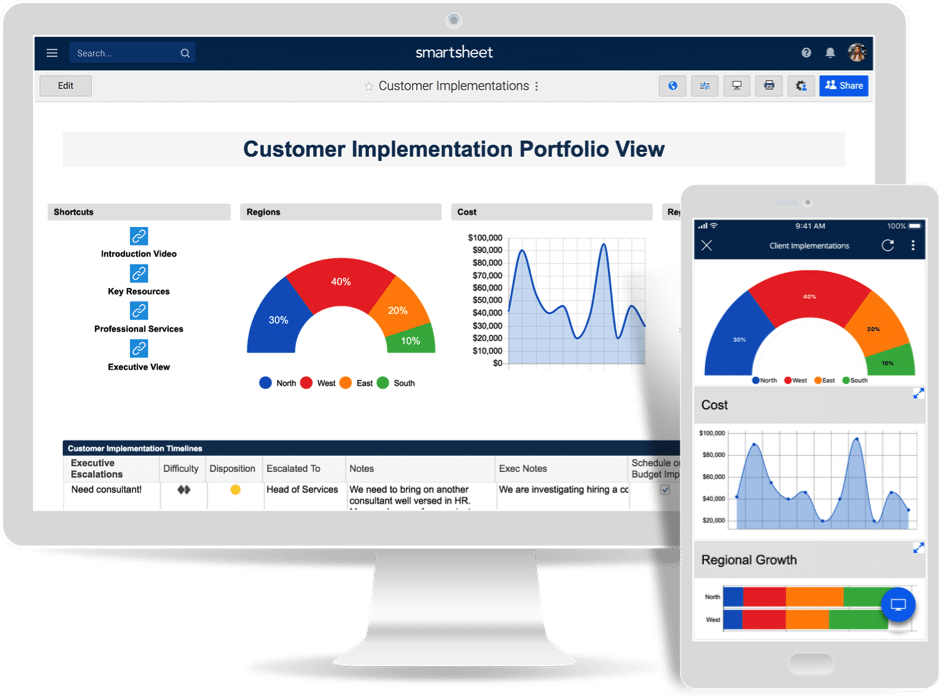
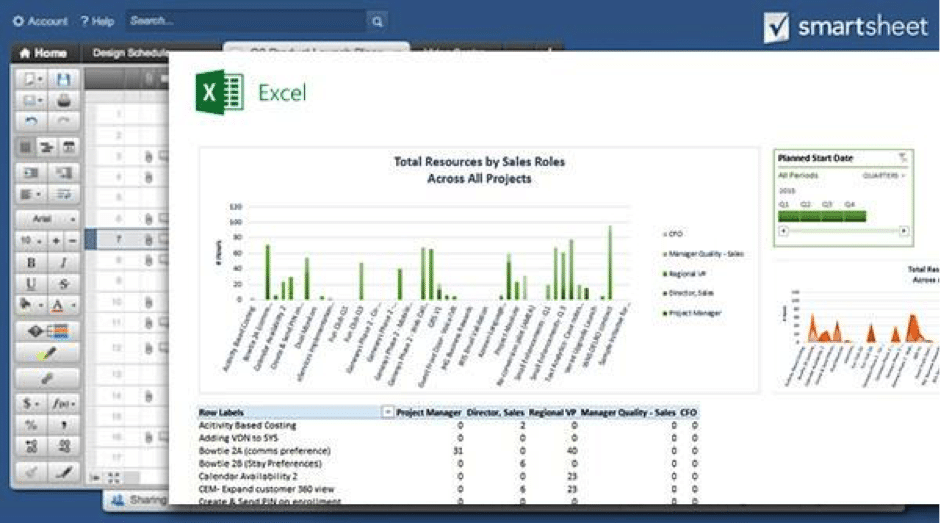
Use the Smartsheet Live Data Connector to bring data from Smartsheet into Excel to pivot and summarize. You have the power to choose exactly how you want to visualize your data, thanks to dozens of chart and graph options in Excel. As data is updated in Smartsheet, your Excel dashboard will also be updated to reflect the latest information.
Create Interactive Dashboards with ClicData
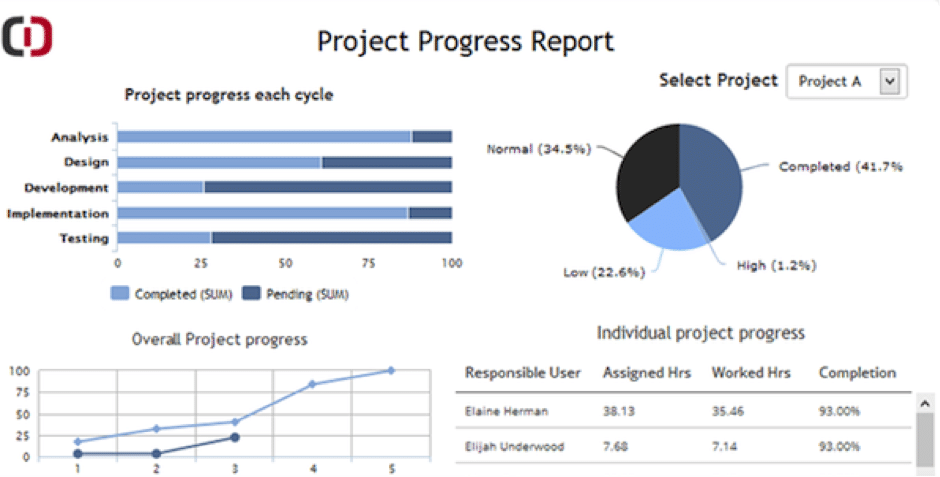
ClicData directly connects to your Smartsheet account to create interactive, self-updating dashboards and reports. Connect and configure your data one time and ClicData will take care of the rest. Your information is always up to date and you can access it at any time.
